


Link to Part I & Part II
Unlike the great circle alignments of monuments, volcanoes and impact craters which can be scientifically tested and analyzed with a computer program, there are other aspects of the Nazca map-plateau that are more graphical in nature. Because these attributes are graphical and cannot be quantified, they are presented in this section not as proof, but in the spirit of cartographic intrigue and of supporting evidence.
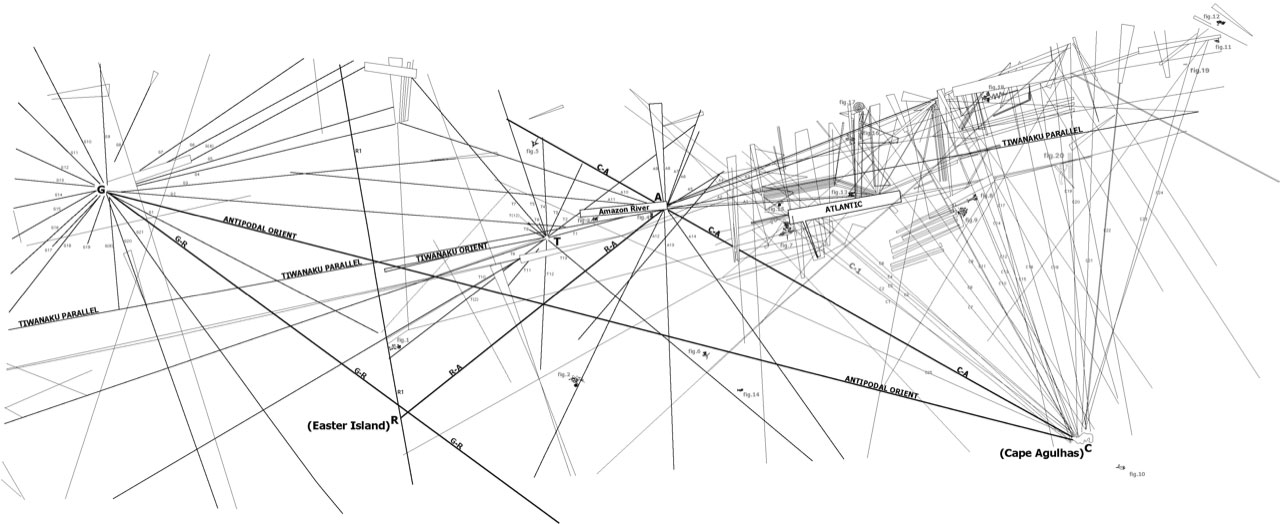
Plate-1b
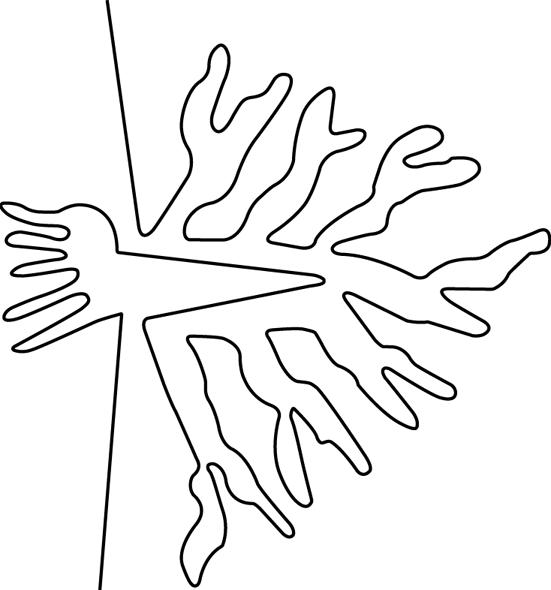
In the hypothesis presented in Part I, the geoglyphs served as indicators of rather broad regions of Earth – with one exception: the Okavango Inland River Delta. The Okavango Delta geoglyph (Figure-9, fig-9 on Plate-1b, Image-23) differs from the other geoglyphs identified in Part I because it does not represent fauna native to a region. The geoglyph specifically represents the topographiccontour of a body of water. The age of the Nazca map is unknown, as is what the Okavango Delta looked like when it was charted. Yet the delta geoglyph resembles the contoured drawing of surface features known in common modern maps. Whatever the age of the Nazca map might be, the Okavango delta geoglyph roughly “approximates” the contour of the delta as it appears today.
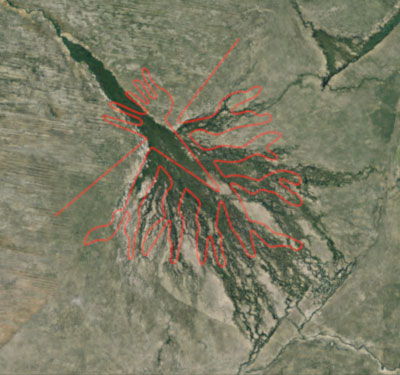
Image-23 Okavango Delta with Geoglyph (Map data © Google)
If one now reconsiders the other geoglyphs on the plateau – even those of fauna – to investigate if they also approximate geology in their respective regions, one finds that many of them seem graphically associated with both topography and bathymetry. The geology represented by a geoglyph can be located on the Earth using as guides their general location on the map-plateau and their association with the Lines and their corresponding Great Circles on the 3-dimensional Earth, as shall be demonstrated.
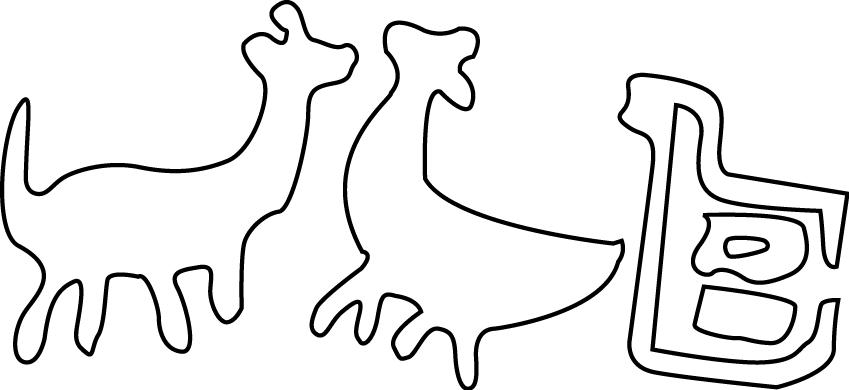
As we did in the hypothesis, we begin with the figure of the Andean llamas and their “corral” (Figure-1). The llamas are graphically (cartographically) keyed to geology when the peculiar outline of their “corral” is associated with the peculiar linear topography of the Peruvian Andes and Peruvian coastline (Image-24, Image-25). The corral’s beaker shaped wester edge bears a close resemblance with the beaker shaped northwestern coastline of Peru. Llamas are unique to the Andean region, making the graphic association of their corral with the Peruvian Andes and coastline an even stronger identifying characteristic. The two amorphous figures within the “corral” are as yet unidentified, as are the two llamas themselves.
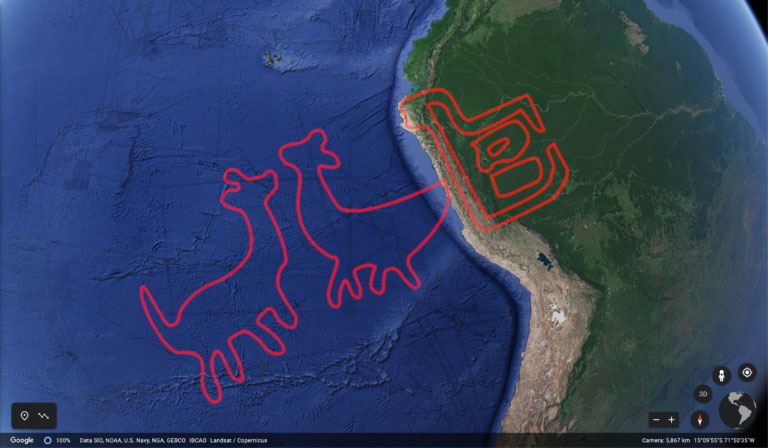
Image-24 Peruvian Coastline with Geoglyph (Map data © Google)
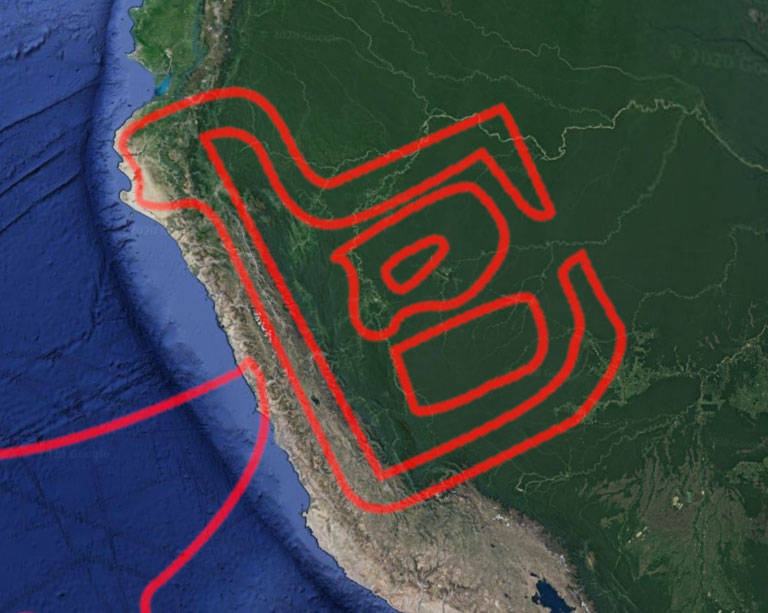
Image-25 Peruvian Coastline with Geoglyph zoomed (Map data © Google)
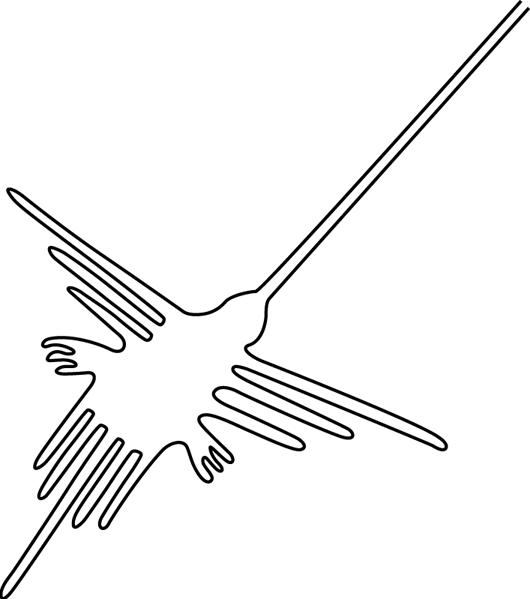
Before continuing it may be wise to say that: if one makes a perfect “boot”, one does not make a perfect Italy. The charters of the Nazca map had to draw geoglyphs that both represented something that belonged in a general region of Earth, while at the same time approximating geology. This is not an easy task. The next example demonstrates how the lines can be used to locate the geology a geoglyph represents. The hummingbird geoglyph (Figure-5) has the particularity of having the tip of its beak terminating “at” primary great circle C-A (Image-26). Its general location on the map-plateau is northwest of the Amazon River radial center. If one tracks primary great circle A-C on the 3-Dimensional projection towards the northwest of the Amazon radial center, one finds that the hummingbird geoglyph seems to approximate the sharp bathymetry of an area south of Cuba and west of Jamaica, called the Cayman Trench (Image-27, Image-28, Image-29).

Image-26 Hummingbird Geoglyph with Line C-A

Image-27 Cayman Tench with Geoglyph and Great Circles (Map data © Google)

Image-28 Cayman Trench Bathymetry zoomed (Map data © Google)
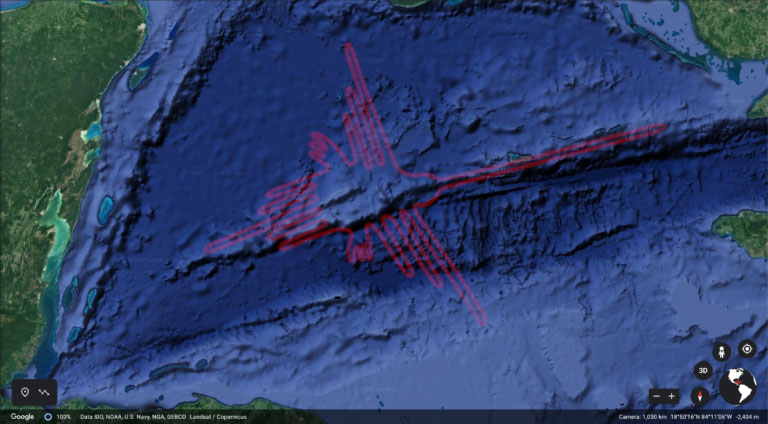
Image-29 Cayman Trench Bathymetry with Geoglyph zoomed (Map data © Google)
We continue with a geoglyph that was not identified and used in Part I to key the map. The geoglyph is traditionally called the “parrot” (Image-30). Whether it is a parrot – or perhaps a type of ant – it is peculiar because it lacks an abdomen or a tail, and has a strange lobe protruding from the left side of its head. On the Nazca map-plateau the figures rear edge is in contact with line c-20 (Image-31), corresponding with green great circle c-20. Scanning along great circle c-20 one encounters the bathymetry of the Straights of Gibraltar, which bears a strong resemblance to the parrot geoglyph (Image-32, Image-33, Image-34).
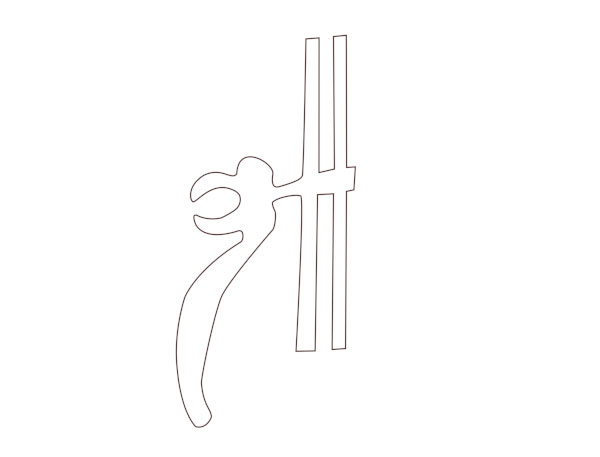
Image-30 Parrot Geoglyph
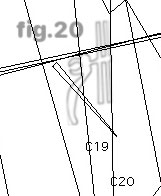
Image-31 Parrot with Lines

Image-32 Straights of Gibraltar with Great Circles
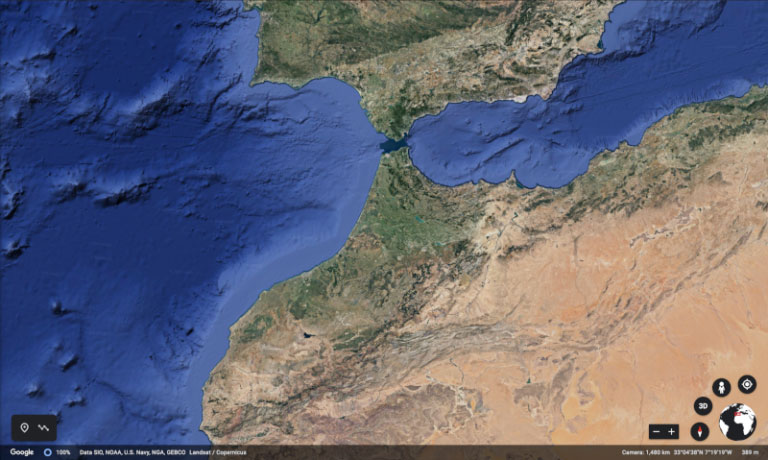
Image-33 Gibraltar Bathymetry (Map data © Google)

Image-34 Gibraltar Bathymetry with Parrot Geoglyph (Map data © Google)
At the other end of the Mediterranean Sea we find the next likeness between a geoglyph and the surface of the Earth in the form of the Mediterranean Fish geoglyph (Image-35, fig.12 on Plate-1b). Like the parrot, this fish has a peculiar protrusion emanating from its head, which mysteriously approximates the Eratosthenes Seamount south of Cyprus. The shape and orientation of the fish’s tail is seen geologically mirrored in the northeastern corner of the Gulf of Alexandretta (Iskenderun) and its shallows (Image-36, Image-37).
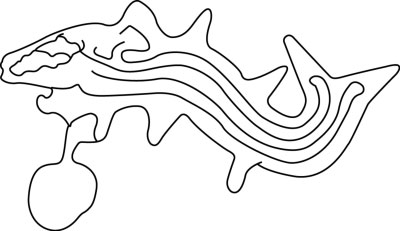
Image-35 Mediterranean Fish with Head Geoglyph
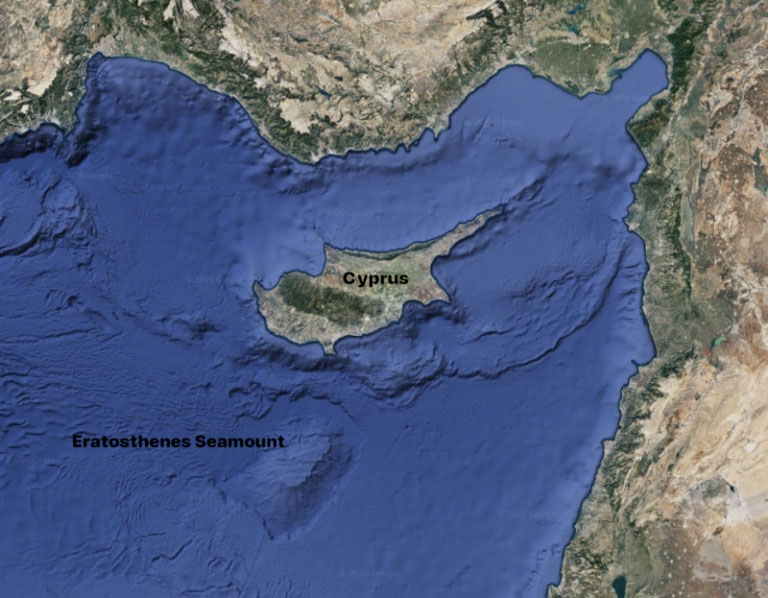
Image-36 Cyprus Area Bathymetry (Map data © Google)
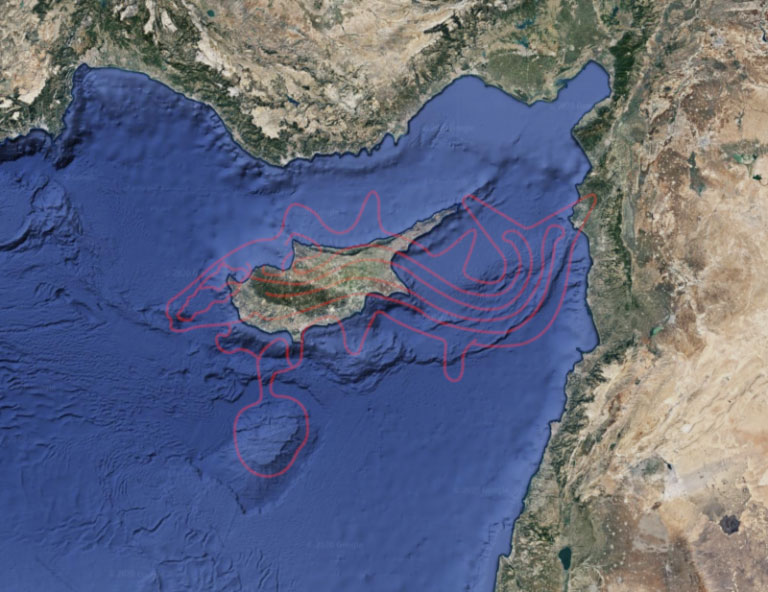
Image-37 Cyprus Area Bathymetry with Geoglyph (Map data © Google)
Now to the strange small geoglyph of a four legged animal that resembles an anteater (Image-38, fig-19 on Plate-1b) and which is shown upside down (in relation to North). The geoglyph touches line c-23 (Image-39) corresponding to great circle c-23 shown in the 3-D projection (Image-40, Image-41).
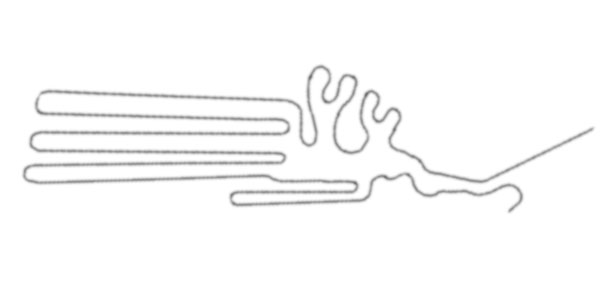
Image-38 Anteater Geoglyph
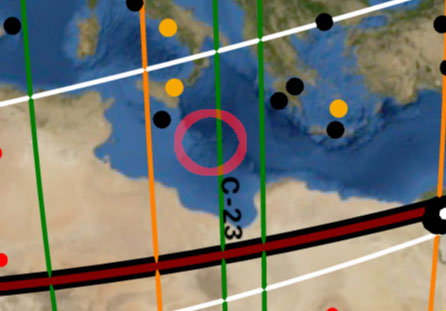
Image-39 Central Mediterranean with Great Circless
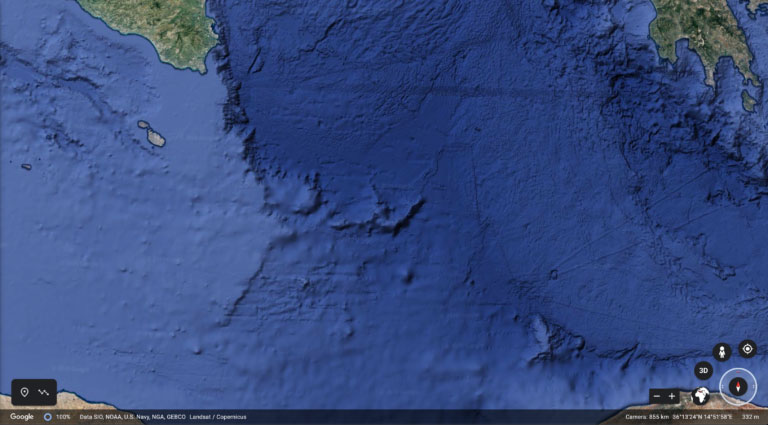
Image-40 Bathymetry southeast of Sicily and Malta (Map data © Google)
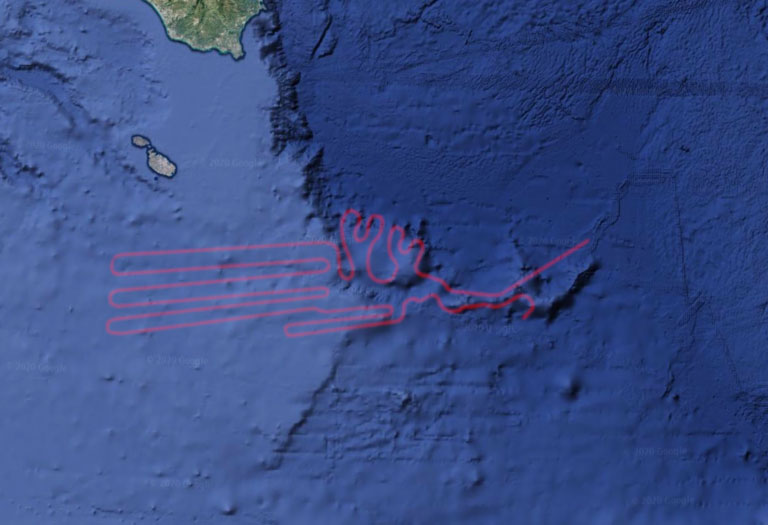
Image-41 Bathymetry southeast of Sicily and Malta with Geoglyph (Map data © Google)
This bathymetric formation is of particular interest, as it correlates with a mysterious “phantom” island (discussed in Underworld by Graham Hancock) which shows up The World Map of Ptolemy (Image-42). An island that is not known to have existed in historical times.
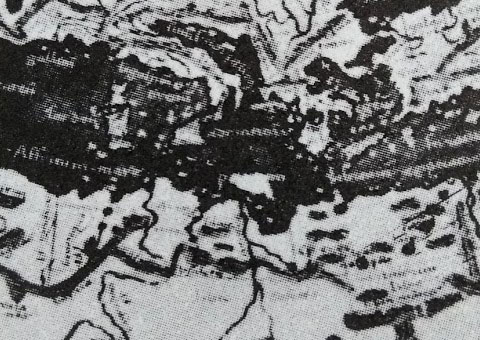
Image-42 Mediterranean with Phantom Island (The World Map of Ptolemy)
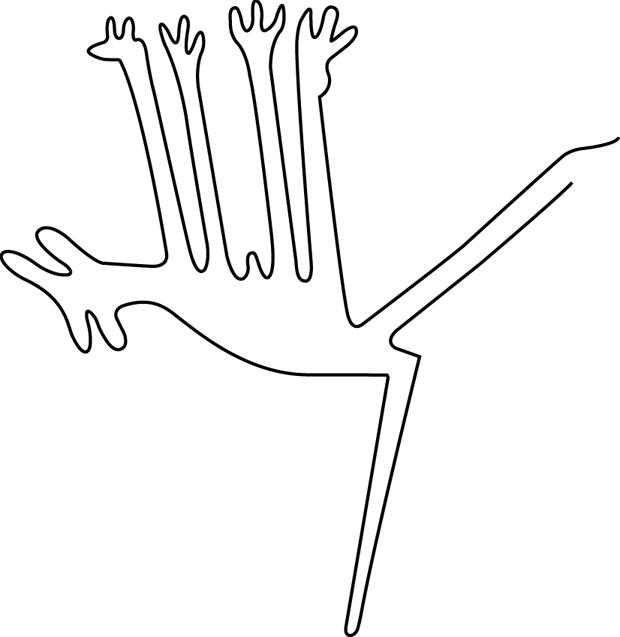
The geoglyph of the person waving their arm, which we call the Patagonian (Image-43, fig.14 on Plate-1b), approximates the bathymetry of the Scotia Plate and Scotia Arc, between Tierra del Fuego and Antarctica. Thus far we have superimposed the geoglyphs over Google Earth spherical imagery. The Patagonian is shown below superimposed both on both the spherical imagery (Image-46) and on a planar bathymetric projection (Image-44, Image-45).
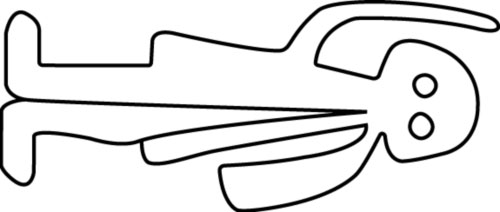
Image-43 The Patagonian Geoglyph
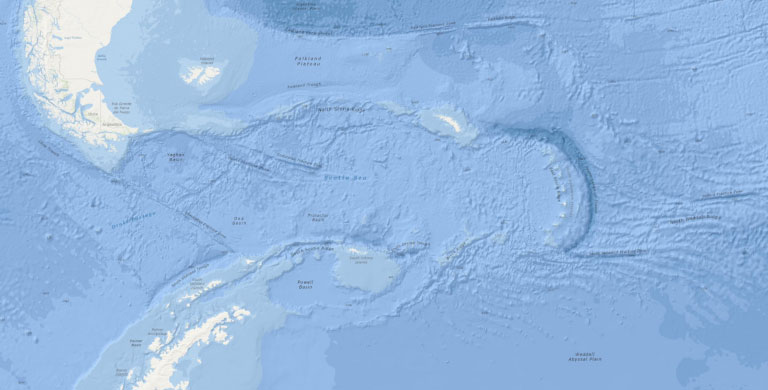
Image-44 Planar Bathymetry of the Scotia Arc (NOAA Digital Atlas)
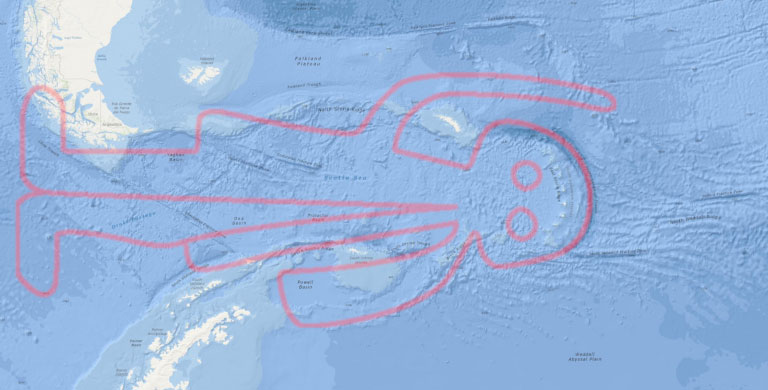
Image-45 Planar Bathymetry of the Scotia Arc with Geoglyph (NOAA Digital Atlas)
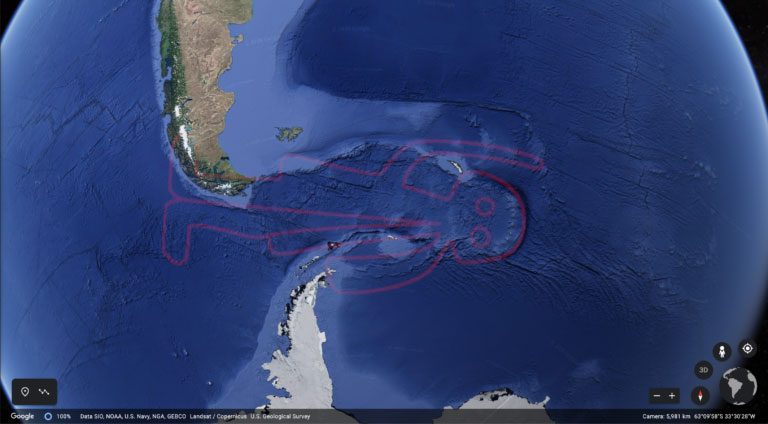
Image-46 Bathymetry of Scotia Arc with Patagonian Geoglyph (Map data © Google)
Northward of the Patagonian geoglyph on the plateau is the Tamandua geoglyph (Figure-6, fig.6 on Plate-1b). The tamandua figure is hanging upside down relative to north, an orientation that makes sense according to the bathymetry of the Rio Grande Rise that is north of the Scotia Arc (Image-47, Image-48).
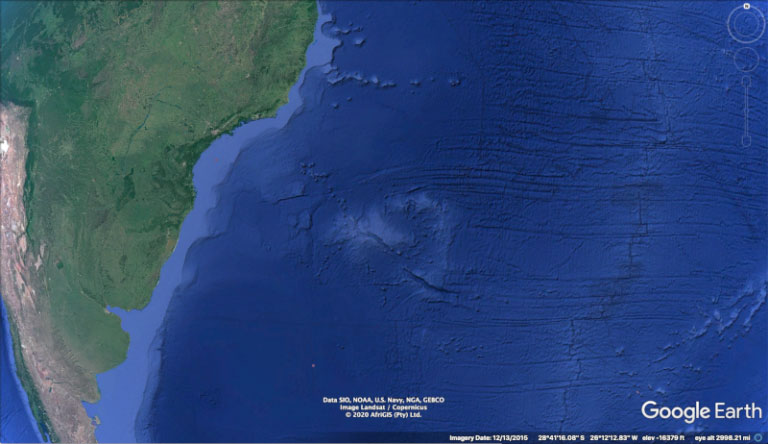
Image-47 Rio Grande Rise Bathymetry (Map data © Google)
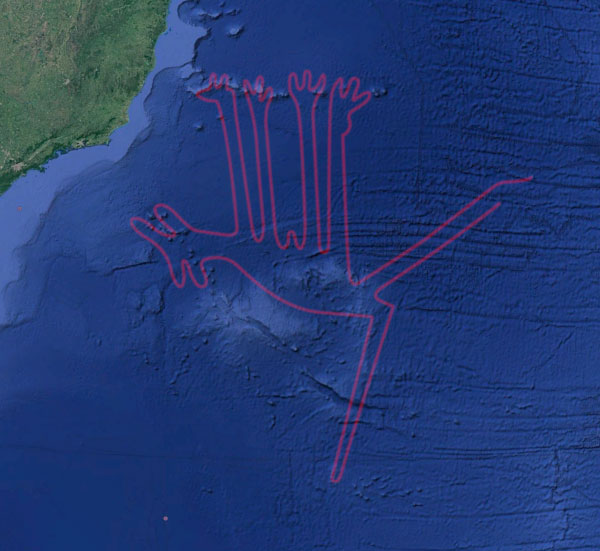
Image-48 Rio Grande Rise Bathymetry with Geoglyph (Map data © Google)
Lastly we consider the geoglyph labeled fig.16 on Plate-1b, shown below (Image-49) and then isolated and rotated (Image-50). With a little imagination the geoglyph appears to represent four or five lakes that spill their water into the polygon representing the Atlantic Ocean. The spillway must be the St. Lawrence River and the SPIRAL seen drawn north of the St. Lawrence River, must be a representation of Manicouagan Impact Crater (Image-51, Image-52 circled in red). The Manicouagan impact crater is one of the most enigmatic impact craters on Earth and one which is clearly visible from space in the form of an enormous ring lake, Lake Manicouagan (Image-53).
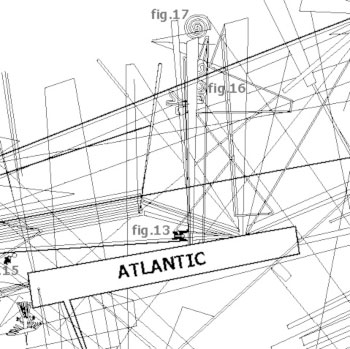
Image-49 Great Lakes Area of Nazca Map-plateau
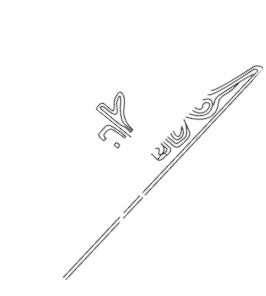
Image-50 Great Lakes Geoglyph isolated
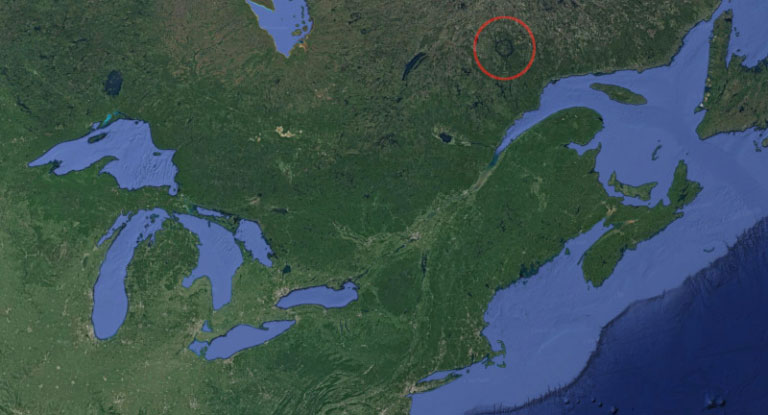
Image-51 Great Lakes and Lake Manicouagan Impact Crater (Map data © Google)
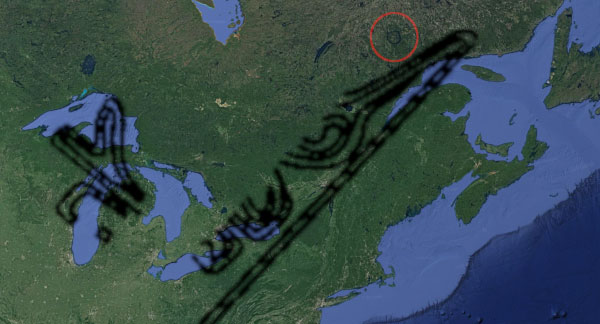
Image-52 Great Lakes and Lake Manicouagan Impact Crater with Geoglyph (Map data © Google)
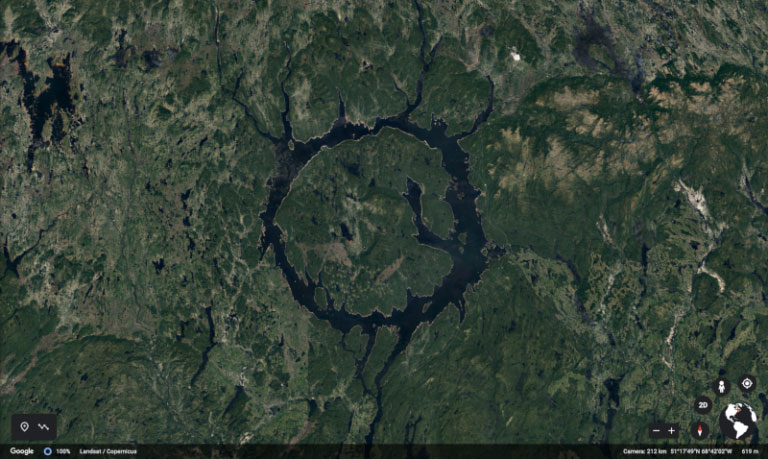
Image-53 Lake Manicouagan Impact Crater (Map data © Google)
More of the geoglyphic figures and spirals of the Nazca map-plateau and their corresponding geology, will be added in the future. See nazcasolution.com for all the latest updates.
This is incredible – great work. Very exciting and in my opinion (only) the effort and excellence, quite unbelievable, for these masters to create these scale geoglyphs, would surely be doing so on what you outline, as they would clearly be capable of capturing this data if they can execute this level of engineering. Thank you.
Prior to the Meltwater Pulses from the glaciers melting, there could have been a series of sea walls constructed with the same means used on cyclopian level pyramids. Lode stnes and singing stone technology, which we have not deciphered yet, could have been a means to make new islands. Arable, habitable land not already occupied by violent mega fauna was at a premium before the Quaternary Extinction Event.
I’m sure it is nothing, but I was liking at the photograph caves in its and in the upper left quadrant is what appears to be a cow or some other herd animal with a blob in the shape of kidney attached to its tail. With this article fresh in my mind, I immediately thought. “Maybe that’s a water hole.” it got me wondering if there were any other examples of this technique of using animal glyphs and shaping them to mirror the land.
Most of the most famous structures of antiquity are not located randomly on the planet. They can be combined into a logical geometric system that allows you to navigate when flying over the Ground.
The entire system of ancient monumental structures (SAMS) is depicted on the plane as geoglyphs in the Nazca desert. This is the answer to the mystery of geoglyphs.
In short, points (centers) are real structures on the Earth’s surface. And the lines and geometric shapes is the azimuth, i.e. the direction between the objects.
Read more here – https://geolines.ru/eng/publications/NAZCA-LINES/